The infographics below are derived from data contained in
BMC's DrinkTell™ Database with Market Forecasts

FIRST QUARTER ADVERTISING IS DOWN-ANY MESSAGE THERE?

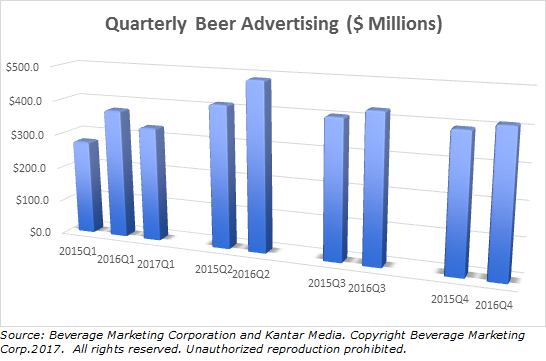
A couple of days ago a detailed report from Citigroup analyst Wendy Nicholson on first quarter U.S. Beer, Wine and Spirits advertising appeared to signal market caution. Nicholson's report led with the note that overall ad spending for the beverage alcohol category was down 6% year over year. That is pretty much what we see in our own DrinkTell™ data supplied quarterly by Kantar Media.

The analyst report covered the relevant topline detail before moving on to look at the specific marketers that Nicholson covers. Most of the year over year spending slide came from beer although vodka was also off, she said. The rest of the spirits categories were reported to have more modest ups and downs.

In the published report that we saw, Nicholson concluded that the critical point of analysis had to be sought in relative market share trends. We decided to follow this thought into DrinkTell™. We started by looking at two years of YOY rather than one. The underlying data raises some questions of its own. Beer did take a tumble but it had also had an astounding gain from first quarter 2015 to first quarter 2016—$276 million to $376 million. That's 36%. First quarter 2017 beer advertising was still almost 21% ahead of spending for first quarter 2015.

What we don't know is the impact of factors such as a swing back toward reliance on measured media (as opposed to social media marketing) as the best way to move barrels.

Next we looked at wine and spirits. Wine simply did not have the swings in measured ad spending that beer did.

Total Spirits advertising did pick up dramatically, however. In the first quarter of this year as compared to the first quarter of last year it was up about 35%. On the other hand, Spirits ad spending in the first quarter of 2016 had tanked (19%) when compared to the first quarter of 2015. While advertising patterns are pretty stable there are also anomalies.

The next to last thing we did was to look at quarterly volume growth (YOY) for all three beverage alcohol categories over a 25-month period. The results: Beer struggled. Volume stagnated or shrank. Wine grew, except for a small slip in the second quarter of 2015, until the first quarter of this year, when YOY volume shrank -0.84%. Spirits happily advanced in each of the measured quarters.


We saved for last our projections for 2017 volume and retail sales growth of each of the categories We see beer volume shrinking (again) in 2017. We estimate it at -1.66%. At the same time, we're predicting a 2.46% gain in retail Beer dollars. We think that Wine and Spirits will also grow dollars at a faster clip than their distributors move cases.

We have to conclude that while it doesn't make sense to deny that there is any connection between advertising dollar ups and downs and product growth (or non-growth) and relative market shares or consumer sales, it's a tenuous one at best. At least as looked at through market wide data.


For questions or to look at our DrinkTell™ database yourself just give us a call. To order a BMC U.S. Wine, Beer, or Spirits Guide, 2017 edition, just click below.

Beverage Marketing Corporation of New York
850 Third Avenue - New York - NY 10022
Tel: 800-275-4630 | Outside U.S.: 212-688-7640
Fax: 212-826-1255