The infographics below are derived from data contained in
BMC's DrinkTell™ Database with Market Forecasts

WINE CONSUMPTION GROWTH: WHY & WHERE

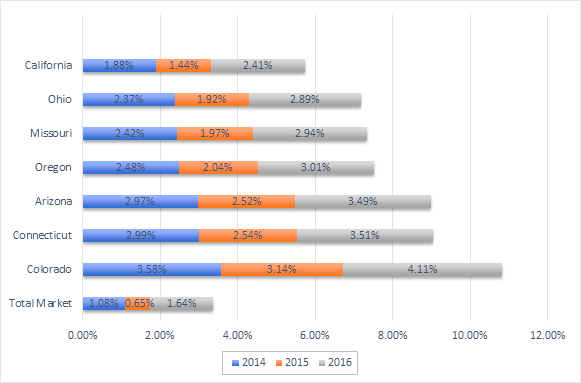
According to DrinkTell™ U.S. wine consumption grew 1.64% last year from 356.4 million 9-liter cases to a little over 362.2 million—a respectable advance given the even more marginal changes in the three previous YOY comparisons.

Dominating the selling strategy are multi-faceted packaging innovations, creative new brand names, a push to higher price tiers, and a focus on Millennial consumers—while not forgetting their deep-pocketed elders. Treasury's just announced launch of a new super premium, Max's Range, with a colorful shrink wrap on the bottle intended to excite a younger generation is emblematic.

Industry marketing efforts have been as wide ranging as they are aggressive. Witness the sophisticated marketing of wine destinations in California's Mendocino Lake counties, Texas Hill Country and many other developed and developing areas, the steady growth of direct sales, and the lobbying-aided erosion of outdated blue laws and other restrictive legislation. Home delivery efforts are likely to become more and more important.

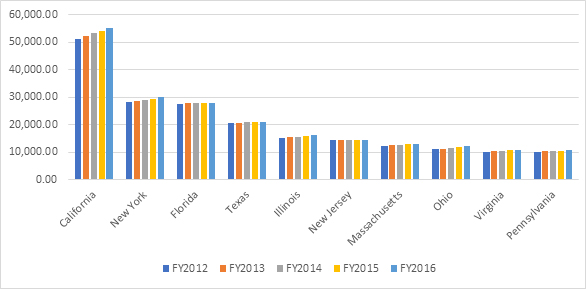
But while it's important to review the reasons given for the "why", we felt we could get a more comprehensive understanding by looking at hard numbers like those in DrinkTell™ at the "where." Where are the sales being made and where are they growing? The top 10 states, ranked by consumption were the same in 2016 as they were in each of the previous four years. Critter labels notwithstanding, there are concentrated markets of wine drinkers. Note that except for a twitch in New York, the most evident growth in this cohort is in California.

Top Ten States 2012-2016 Volume
000 9-Liter Cases

So, where is the growth coming from? From the top 25 wine-consuming states we took the YOY volume growth rates of the seven with above the norm growth for each of the past three years. Besides high volume California, these target states are Ohio, Missouri, Oregon, Arizona, Connecticut, and California. These are growth rates that are compounding nicely—they represent incremental sales. So, whether the "why" is well off baby boomers watching the river run by, or any one of the other many demographic or occasion slots that explain purchase behavior, we can see another explanatory picture of the market in the "where" volumetrics in DrinkTell™.

Selected States 3 Yr Growth

Longitudinal analysis like that provided by DrinkTell™ can help temper over-reliance on trends that may only be fads. We haven't finished charting the most recent data on consumption volume growth by varietal, but looking at what's been happening in recent years is another way to evaluate incremental opportunity. That's the "what" as well as the "why." The big guys—Chardonnay and Cabernet—are still growing. But larger percentage YOY growth is coming from Red Blends and Meritage, Pinot Grigio and Sauvignon Blanc. Pinot Noir has also been strong and steady. If you'd like to see more of DrinkTell™ or have any questions, please let us know.

Beverage Marketing Corporation of New York
850 Third Avenue - New York - NY 10022
Tel: 800-275-4630 | Outside U.S.: 212-688-7640
Fax: 212-826-1255