The infographics below are derived from data contained in
BMC's DrinkTell™ Database with Market Forecasts
 |
 |
| 'TIS THE SEASON TO BE JOLLY? |
Beverage alcohol consumption is driven by holiday celebrations. For most of us that's an article of faith. Traditional promotions both for beverage alcohol and hospitality in general have long lived by that general perception. Marketers have been hanging their hat on Cinco de Mayo, Mother's Day, Graduations & Weddings, Memorial Day, July 4th, Halloween, Thanksgiving and Christmas and a raft of newer celebrations for decades. Promotional tools and advertising practices that used to fuel consumption like packaging and glassware promos, television campaigns, seasonal products and magazine supplements have exploded to include an arsenal of social media marketing channels, celebrity and rock star events, gala parties for "influencers" and much more.
It would be a rare marketer who didn't have the numbers to prove that their holiday campaign "succeeded." So, rather than challenge our industry's consensus view, we decided to take a dive into our DrinkTell™ database to look at year-to-year changes in in wine, beer, and spirits consumption by season. The underlying question we're really asking is 'Does promotional activity have any obvious influence on the trajectory of marketplace change?'
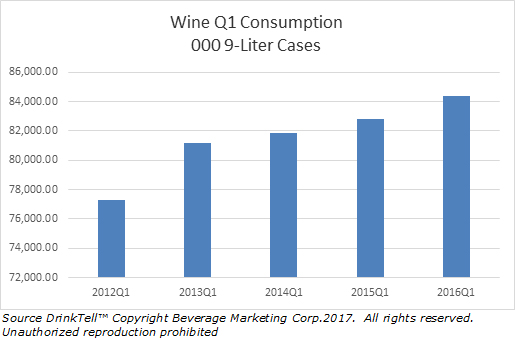
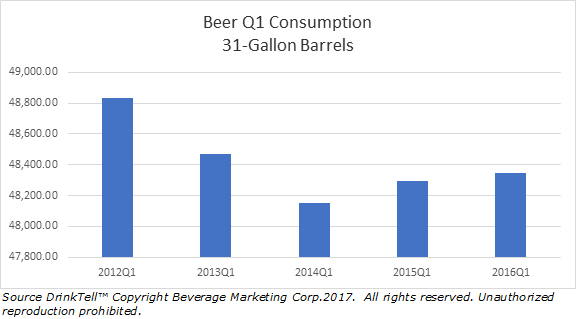
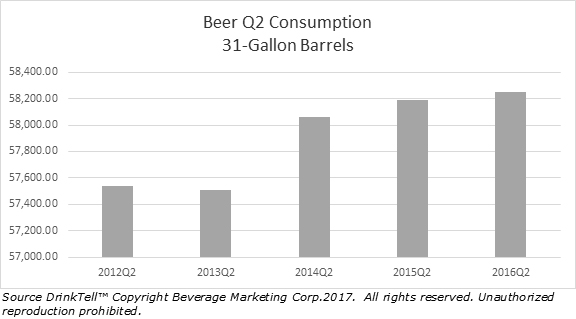
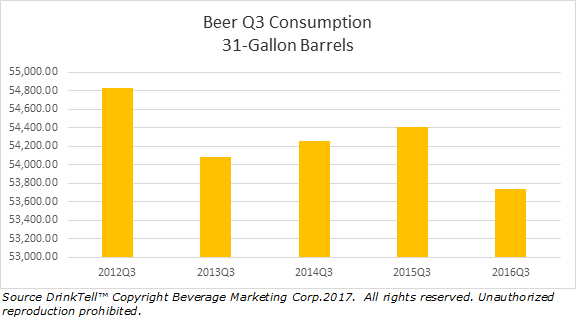
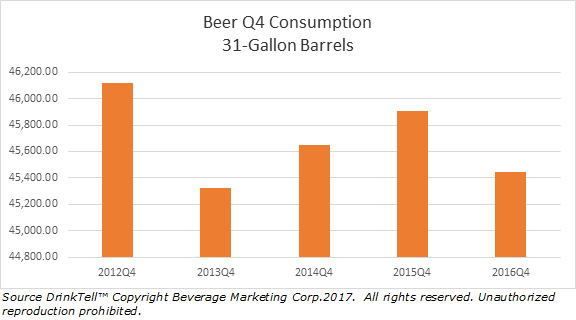
In preparing the charts below, we looked at quarterly data for each of five successive years, 2012 to 2016. The important thing isn't really the numbers themselves but the pattern of change from year to year in each quarter—and whether we think there's any holiday promotion association with what we see.
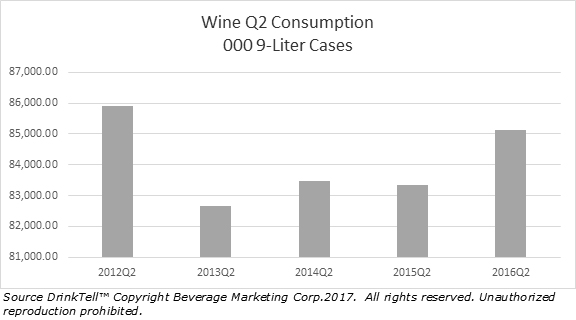
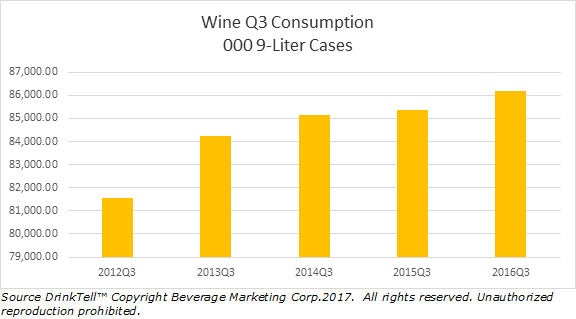
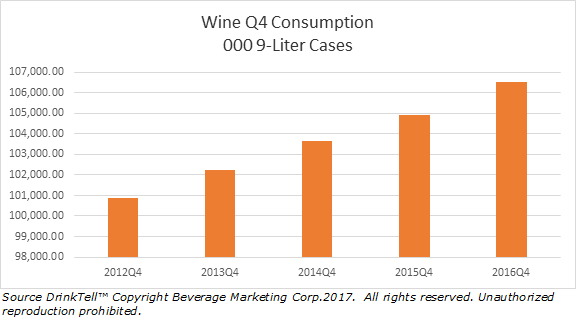
First, wine. Wine consumption made its biggest and most dependable gains in the 4th quarter. While there's no proof of a Winter Holiday cause and effect, there is at least a correlation here. On the other hand, there's none with the 2nd quarter. Yet many vintners have told us that the second quarter (again Mother's Day, Graduations, Wedding Season) along with the lead up to Thanksgiving, Christmas, and New Year's are the best times to promote wine. |
 |
 |
 |
 |
Beer? Traditional beer consumption patterns—warm weather, football season—don't fit squarely into a first, second, third, and four quarter format. Nonetheless, given the immense popularity in this country of both college and professional football with the related food and beverage consumption patterns, we think we can be forgiven for succumbing, at least momentarily, to an erroneous assumption. We initially felt that we wouldn't be surprised if the beer market had offered us charts similar to those of wine at least in terms of 4th quarter comparisons. But beer consumption—troubled by the soft sales of the mega-brands and changing in product focus in recent years—jumped the rails. The actual data (showing only second quarter gains) chastened us. It's getting warmer in April, May, and June but in most of the country it's not hot. |
 |
 |
 |
 |
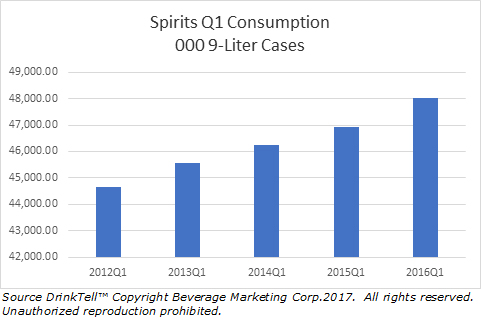
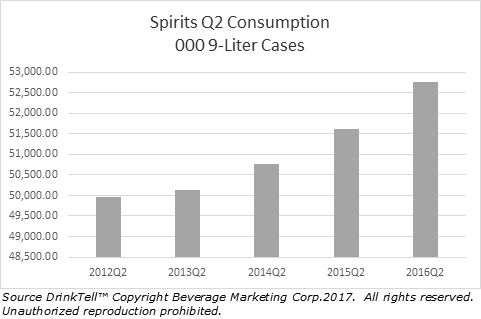
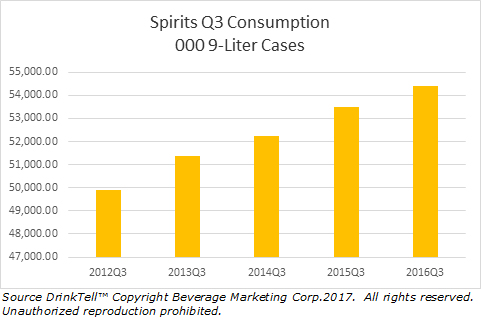
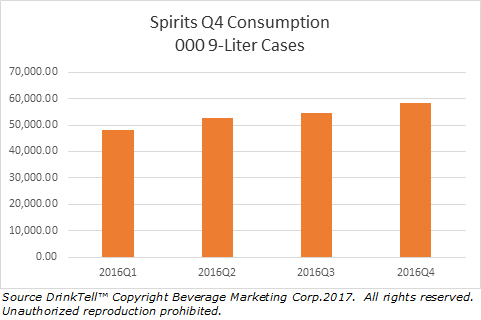
Finally, spirits. Domestic spirits consumption grew year over year in each of the four quarters from 2012 to 2016. Fourth quarter growth was relatively marginal. The biggest change over the five-year period was in the second quarter. Every quarter but the last, however, showed a steady march upward. We think that taken together this view of wine, beer, and spirits consumption answers our "underlying question" regarding promotions versus trends. Most important, it does so in a way that is helpful. Aside from wine's 4th quarter gains there is no consistent association we can see with holidays and promotional seasons. (The inescapable conclusion is that promotions can't really trump trends—just as marketing can't trump strategy, at least in our view. Note that we're not taking this as a knock on using holiday promotions and similar marketing tactics to garner incremental sales.
What we are saying is that the biggest support for strategy development is not a new promotion. The analyst's best tool is data, especially in-depth data like that found in Beverage Marketing Corporation's DrinkTell™ database. |
 |
 |
 |
 |
Evaluating multifaceted marketplaces like those of wine, beer, and spirits is challenging. The consumer is, of course, king. But much consumer research is "soft," depending on survey and panel information that is not as reliable as the "hard" consumption numbers found in a longitudinal database. That's just one more reason why we think that really understanding a marketplace requires use of resource like DrinkTell™. For questions about this column or to look at our DrinkTell™ database yourself just give us a call. To order a BMC U.S. Wine, Beer, or Spirits Guide, 2017 edition, click below. |
|
|


