Press Release: Bottled Water Growth Accelerates, New Report From Beverage Marketing Corporation Shows
8/15/2016
BOTTLED WATER GROWTH ACCELERATES, NEW REPORT FROM BEVERAGE MARKETING CORPORATION SHOWS
***
Volume and sales reach record highs
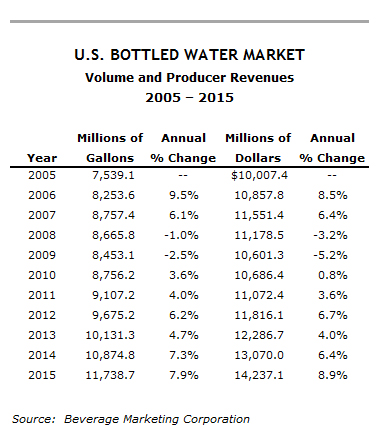
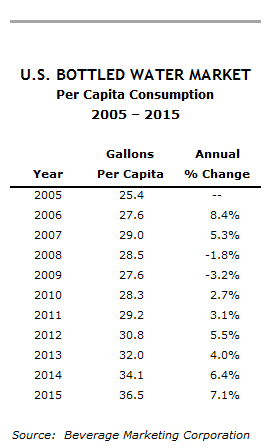
NEW YORK, NY, August 15, 2016: Charting a second year in a row of quickening growth, U.S. bottled water volume reached an historical high of nearly 12 billion gallons in 2015. After growing by 7.3% in 2014, volume grew by nearly 8% in 2015. Wholesale dollar sales also accelerated and exceeded $14.2 billion in 2015. Per capita consumption reached a new peak of 36.5 gallons.
Before the economic setbacks of the late 2000s, bottled water enjoyed a lengthy streak of very fast volume growth, as documented in U.S. Bottled Water through 2020, Beverage Marketing Corporation's most recent report on the market. Like many other beverage categories in the United States during the depths of the economic recession, bottled water suffered downturns in 2008 and 2009. But in 2010, bottled water volume returned to growth. The category showed renewed vitality in 2011, and growth accelerated in 2012. Growth was faster in 2014 than in 2013, and much more vigorous than most major liquid refreshment beverage segments. The even faster growth in 2015 was especially noteworthy for a category of its size: bottled water ranked as the number–two beverage type by volume, and it could surpass carbonated soft drinks to take the top spot in the very near future.
–Domestic non–sparkling water perennially reigns as the biggest segment of the U.S. packaged water industry. Domestic non–sparkling water's 11.2 billion gallons represented more than 95% of total volume in 2015.
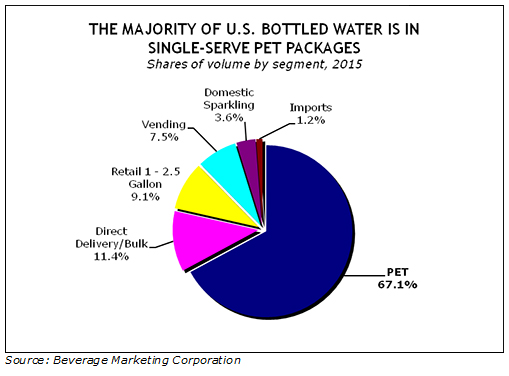
The non–sparkling category includes various components that typically perform quite differently from one another. In 2015, for the fourth year in a row, all four segments registered growth, albeit at dissimilar rates. Throughout most of the 1990s and 2000s, the retail premium segment – consisting of still water in single-serve polyethylene terephthalate (PET) bottles – drove the overall category's development. Indeed, the PET component enlarged by a double–digit percentage rate 16 consecutive times through 2007. In 2015, the segment advanced by 8.9%, catapulting volume to 7.9 billion gallons and market share to more than 67%.
Retail bulk volume experienced some reversals as more than a few consumers chose convenient PET multipacks in large format retail channels instead of larger (1 to 2.5 gallon) sizes. Its share slid from nearly one–quarter of the category volume at the beginning of the century to just above 9% by 2015, largely due to competition from PET. After multiple declines, the segment did grow each year from 2011 to 2015, but retail bulk's 3.7% uptick lagged the overall category and was the second slowest of any domestic still water segment in 2015. Direct delivery also confronted intramural competition from portable PET bottles. The segment, which comprised the largest of them all as recently as the mid–1990s, accounted for less than 12% of total volume by 2015. U.S. home– and office–delivery (HOD) volume slipped from close to 1.4 billion gallons in the early 2000s to 1.3 billion gallons in 2015, when volume moved up by 4.1%.
The relatively small, essentially regional vending segment involving refillable jug containers achieved growth even in the years when total bottled water volume declined. Its low cost during economic hard times undoubtedly had something to do with vending's positive results. It continued to grow in 2015, albeit at a far slower rate than any other segment of the domestic still water market or the bottled water market as a whole. (It inched up at a lower rate than HOD.)
Both of the two segments outside the domestic non–sparkling realm grew in 2015, and did so dramatically. The imported water segment, the smallest of them all, is prone to fluctuations. In the 2000s, it registered double–digit percentage growth in some years, and equally sizeable contractions in others. After one of those up years in 2007, imported water's volume fell sharply in 2008 and then plummeted precipitously in 2009. It continued to shrink in 2010 before inching up by a modest clip in 2011. Volume dropped dramatically again in 2012, but did move up (at a market–trailing pace) in 2013. In 2014, in contrast, imports notched their first double–digit growth rate since 2007, and they enjoyed another one in 2015. Sparkling water held a small share of bottled water volume but grew at a rate faster than any other type, including retail PET (as well as imports), in 2015.
New York City–based Beverage Marketing Corporation is the leading research, consulting and financial services firm dedicated to the global beverage industry.
###