New Study: Bottled Water's Impact On U.S. Caloric Intake
6/6/2016
BOTTLED WATER'S IMPACT ON U.S. CALORIC INTAKE
2000 – 2015
Summary of U. S. Caloric Savings Due to Bottled Water
Over the past two decades, bottled water has been the leading growth category in the U.S. beverage market. Volume approached 11.7 billion gallons in 2015, growing from 4.7 billion in 2000. Likewise, bottled water per capita consumption has soared over this period — growing from 16.7 gallons in 2000 to 36.7 gallons in 2015, which represents a large gain of 20 gallons per person.
In contrast, all other remaining non–bottled water liquid refreshment beverages (LRBs) combined declined in both total volume and per capita consumption. Over the 2000 to 2015 period, non–bottled water LRBs — carbonated soft drinks, fruit beverages, energy drinks, sports beverages, ready–to–drink (RTD) tea, RTD coffee and all forms of milk — decreased from 27.0 billion gallons to 25.8 billion gallons while combined per capita consumption for these beverages dropped from 95.7 gallons to 80.1 gallons or a 15 year loss of 15.6 gallons per capita.
Bottled water's success has been driven in part by America's move to healthier beverage choices, which has resulted in calorie savings for all Americans. In this analysis, Beverage Marketing Corp. (BMC) has attempted to quantify the calories saved by consumers over this 15 year period as they switched to bottled water from other more caloric LRBs.
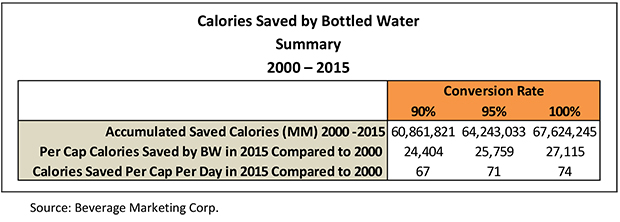
In BMC's analysis, Americans have collectively saved between 61 trillion and 68 trillion calories over this 15 year period thanks to the rise of bottle water and the move away from other caloric LRBs. On a per capita basis, this has resulted in an annual savings of between 24,404 and 27,115 calories by 2015 compared to 2000. On a daily basis, the caloric savings in 2015 ranged between 67 and 74 calories per day. As consumers continue to drink more bottled water, these savings will become even greater in the years ahead. Caloric savings of this size and magnitude by any food or beverage category are rare.
Methodology
BMC first gathered the total volume consumed for bottled water as well as each non–alcoholic liquid beverage category — carbonated soft drinks, fruit beverages, sports drinks, energy drinks, RTD tea, RTD coffee, value–added water as well as all forms of milk — for each year from 2000 to 2015 using BMC's proprietary U.S. beverage databases.
For the period from 2010 through 2015, the caloric value of beverage categories was calculated by performing a detailed analysis of caloric content by brand. The total caloric content of each brand was calculated by multiplying its calories per gallon by its total volume for each year. For the small volume of untracked brands, BMC used the caloric per gallon average for the identified brands as a proxy to determine these brand's calorie values. Each category's calories by brand were then summed to reach a total annual calorie count for the respective category. From this, BMC next calculated the average calories per gallon per year for each LRB category. The average annual calories per gallon for each category were summed to determine a total non bottled water average annual LRB per gallon calorie count.
For the period from 2000 to 2010, BMC calculated the caloric value of each non bottled water LRB category by multiplying the annual volume of each category by BMC's estimate of the average caloric content per gallon based upon a representative sample of brands for each category. Each LRB category's growth rates were utilized to carry the analysis back from 2010 to 2000. Additionally, an annual beverage caloric count for each category as well as a total annual LBR caloric count were calculated.
To calculate the annual calories saved by switching from caloric LRBs to bottled water, BMC multiplied the annual cumulative increase in bottled water per capita gallons for each year from 2000 by the average annual LRB caloric per gallon content for the respective year. Since a small amount of LRB switching may have been to new emerging categories such as coconut waters, HPP juices, cold brewed coffees or even to alcoholic beverages or tap water, BMC conservatively discounted each year's per capita LRB calorie figure before arriving at a range of caloric savings based upon consumers switching their more caloric LRB consumption to zero calorie bottled water.
Bottled Water Calorie Saving Analysis
Over the past two decades, bottled water has been the leading growth category in the U.S. beverage market. Volume reached 11.7 billion gallons in 2015, growing from 4.7 billion in 2000, a large 7.0 billion gallon increase. See Exhibit 1.
Exhibit 1
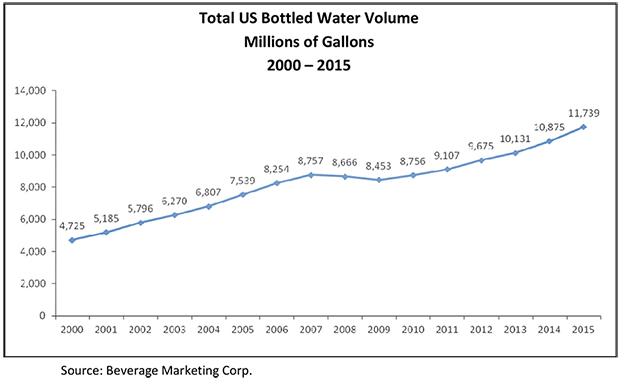
Likewise, per capita bottled water consumption soared over this period — growing from 16.7 gallons in 2000 to 36.7 gallons in 2015, a large gain of 20 gallons per person per year over this time period, as shown in Exhibit 2.
Exhibit 2
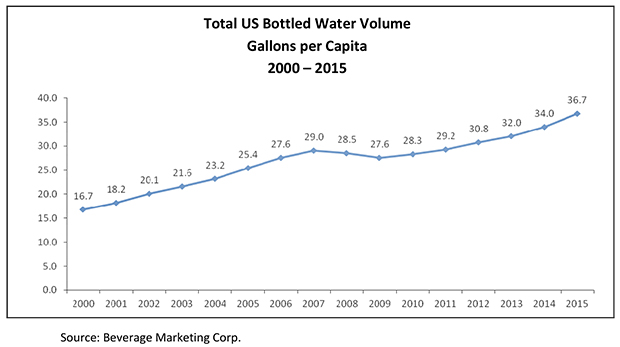
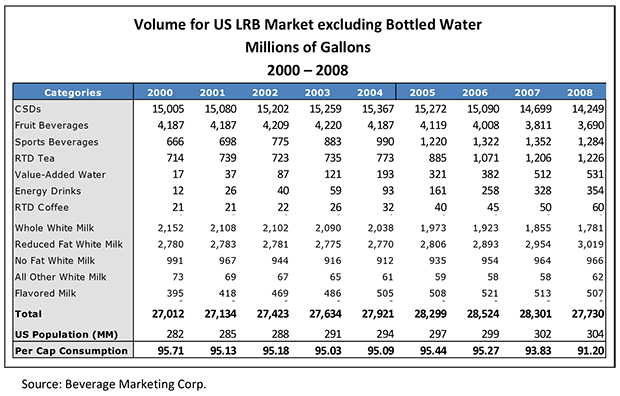
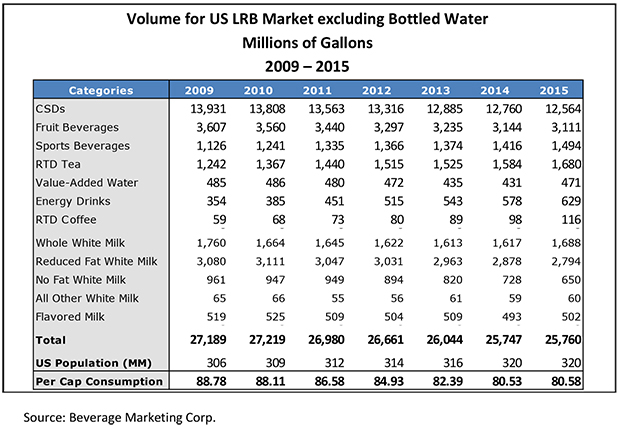
In Exhibit 3, the non–bottled water LRB category volumes are presented for the years 2000–2015.
Exhibit 3
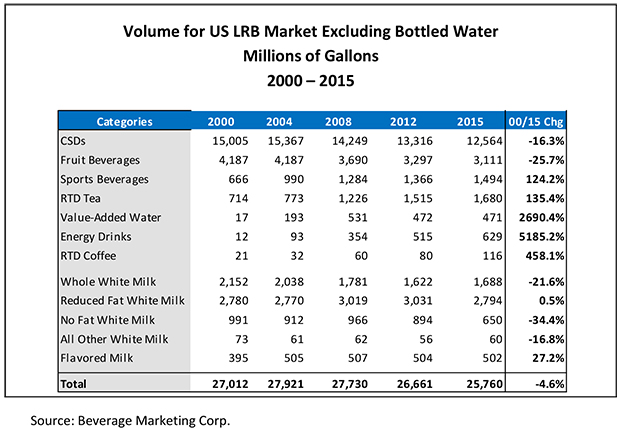
For this analysis, non–bottled water LRBs include carbonated soft drinks, fruit beverages, sport beverages, energy drinks, ready–to–drink (RTD) teas, RTD coffees, value–added water and all forms of milk. For 2015, these LRB categories ranged from a high volume of 12.6 billion gallons for carbonated soft drinks to a low of 116 million gallons for RTD coffee. Over the 15–year 2000–2015 period, total non–bottled water LRB volumes declined from 27.0 billion gallons in 2000 to a low of 25.8 billion gallons in 2015, a 4.4% decline.
Similarly, over the 2000 to 2015 period, the per capita consumption of non–bottled water LRBs declined from a high of 95.7 gallons in 2000 to a low of 80.1 gallons in 2015, a decline of 15.6 gallons per capita over this time period, as shown in exhibit 4.
Exhibit 4
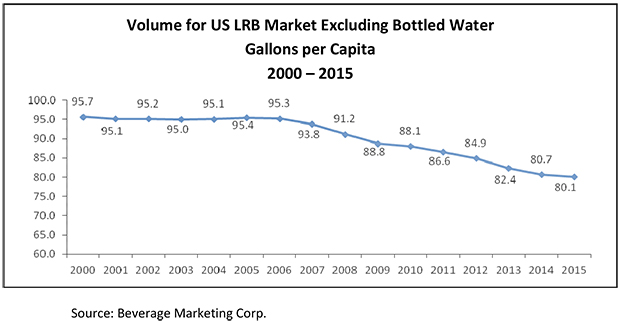
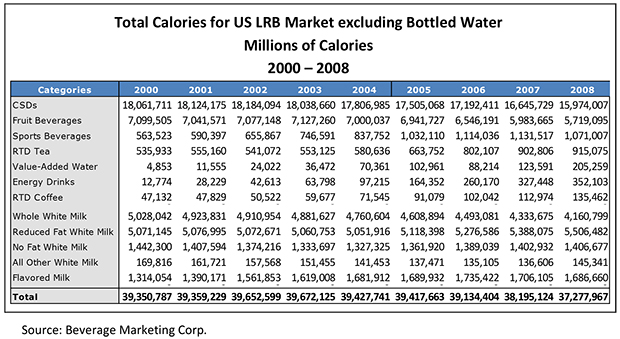
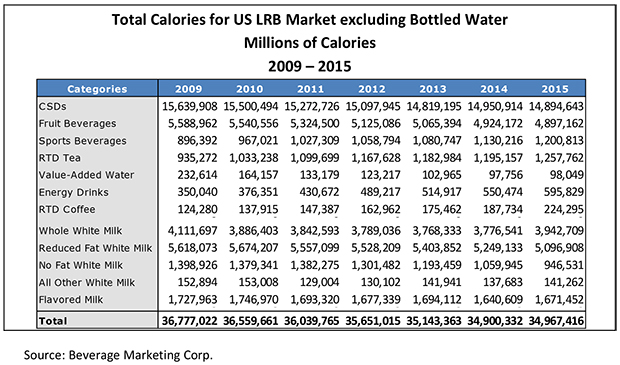
Exhibit 5 shows total calories for each beverage category between 2000 and 2015. In 2015, the largest calorie totals were for carbonated soft drinks at 14.9 trillion calories, followed by all forms of milk at 11.8 trillion calories and fruit beverages at 4.9 trillion calories. RTD tea and sports drinks were similar at 1.3 and 1.2 trillion calories, respectively. The smallest caloric LRB categories were energy drinks at 596 billion calories, RTD coffees at 224 billion calories and value–added waters at 98 billion calories.
Exhibit 5
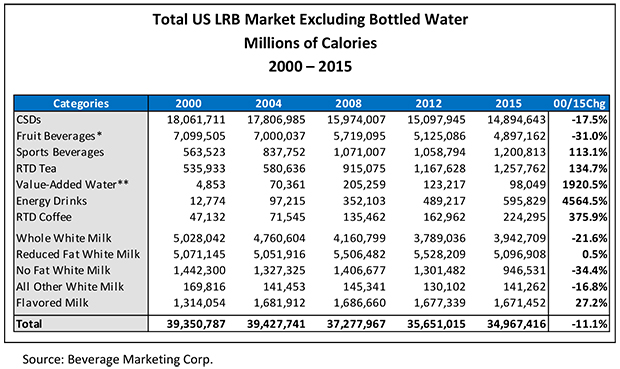
Over the 15–year 2000 to 2015 period, non–bottled water LRBs declined by 4.4 trillion calories or 11.1%.
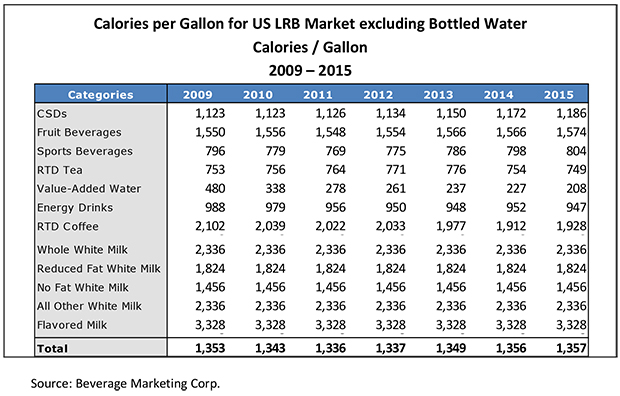
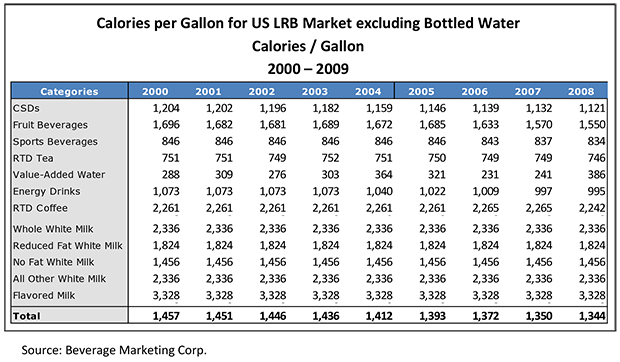
In Exhibit 6, average calories per gallon for each non–bottled water LRB category from 2000 to 2015 are shown.
Exhibit 6
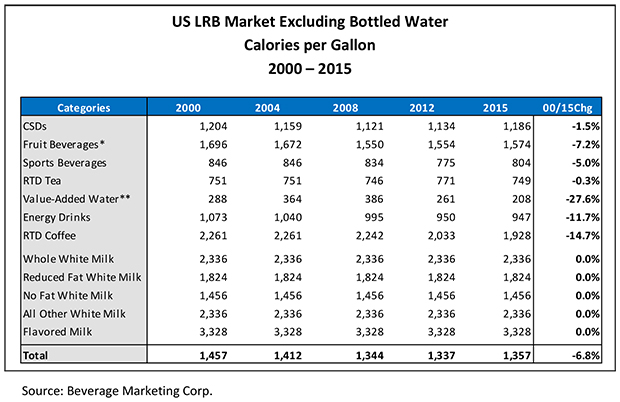
For 2015, the most caloric category is flavored milk at 3,328 calories per gallon; the least caloric, with 208 calories per gallon, was value–added water. Total non–bottled water LRB calories per gallon steadily declined from 2000's 1,457 calories per gallon to 2015's low of 1,357 calories per gallon, a 6.8% decline.
In calculating the calories saved by switching from non–water LRBs to bottled water from 2000 to 2015, BMC first compared the 15.6 gallon per capita loss in non–bottled water LRBs to bottled water's higher 20.0 gallon gain. As a consequence, the entire non–bottled water LRB per capita decline of 15.6 gallons, or 100% of the drop–off, could be accounted for by consumers switching to bottled water. However it is likely some small percentage of these non–bottled water LRB users did not switch to bottled water, but to the new emerging LRB categories such as coconut waters, HPP juices, cold brewed coffees, etc., or even to alcoholic beverages or tap water. To account for this volume and in an attempt to conservatively estimate the caloric savings due to consumers switching to bottled water, BMC in its analysis used two lower conversion rates for non water LRB volume switched to bottled water of 90% and 95%. By using the lower 90% and 95% conversion rates, a high 1.17 billion to 587 million gallons, respectively, of bottled water were dropped from the analysis, more than enough volume to account for the relatively small non–water LRB volume not converting to bottled water.
Finally, the remaining 4.4 per capita gallon bottled water gain not accounted for by non–bottled water LRB switchers can be attributable to bottled water sourcing volume directly from tap water, replacing tap water used to make coffee and tea, and even sourcing some volume from alcoholic beverages such as beer. Additionally, a small percentage of bottled water is often used for other purposes such as filling a pet's water bowl or watering a plant. For this analysis, three non–bottled water conversion rates, 90%, 95% and 100%, were used to calculate the calories saved from switching to bottled water from other caloric LRB beverages.
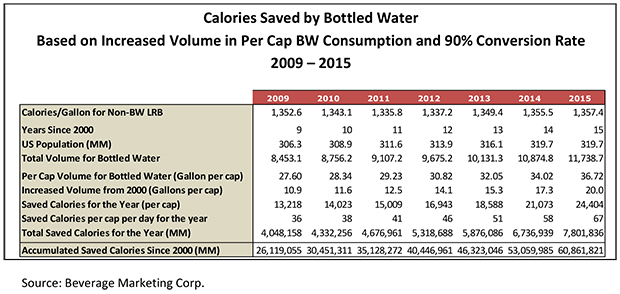
In exhibits 7a and 7b, the calories saved by consumers switching to bottled water from other sweetened LRBs using a 90% conversion rate are shown. Starting from a base year of 2000, on average, consumers saved 1,876 calories per capita per year or 5 calories per day in 2001 by replacing sweetened LRBs with bottled water. The total calories saved in 2001 versus 2000 by all consumers reached 535 billion calories. By 2015 compared to 2000, the average annual per capita saving reached 24,404 calories or 67 calories per day. Total calories saved for 2015 reached 7.8 trillion. On a cumulative basis, total calories saved over the 15 year period was a high 60.9 trillion.
Exhibit 7a
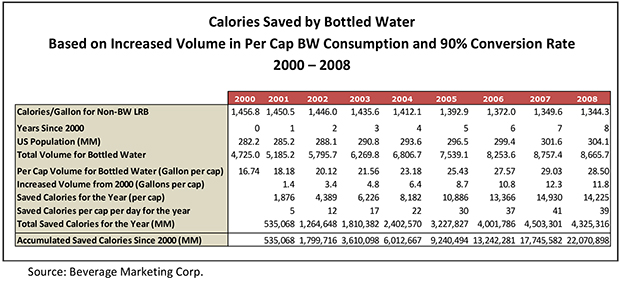
Exhibit 7b
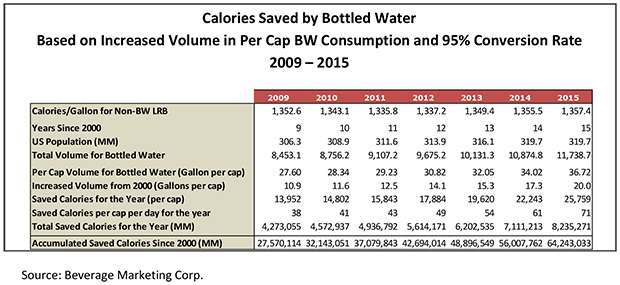
Exhibits 8a and 8b show the calories saved using a 95% conversion rate. Starting from the base year of 2000, on average, consumers saved 25,759 calories per capita per year or 71 calories per day by 2015 compared to 2000 by replacing sweetened LRBs with bottled water. The total number of calories saved in 2015 by all consumers was 8.2 trillion. On a cumulative basis, the total calories saved over the 16 year period reached a high 64.2 trillion.
Exhibit 8a
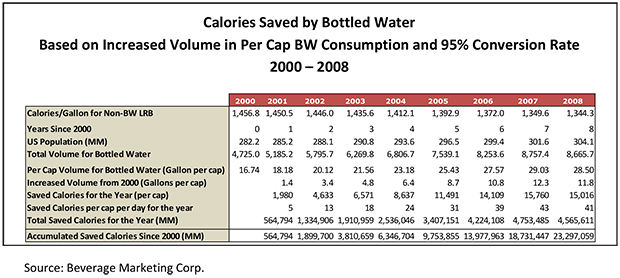
Exhibit 8b
In Exhibits 9a and 9b, the calories saved by consumers switching to bottled water from other sweetened LRBs using a 100% conversion rate are shown. Starting from a base year of 2000, on average, consumers saved 27,115 calories per capita per year or 74 calories per day by 2015 compared to 2000 by replacing sweetened LRBs with bottled water. The total number of calories saved in 2015 by all consumers was 8.7 trillion. On a cumulative basis, the total number of calories saved over the 15 year period was a high 67.6 trillion.
Exhibit 9a
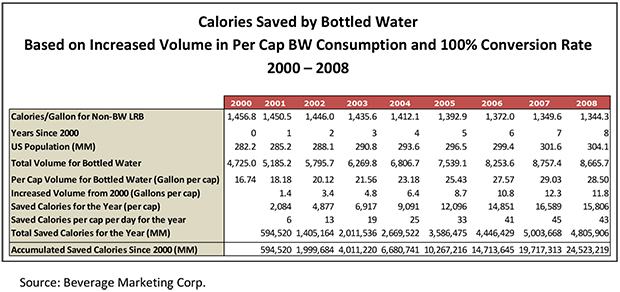
Exhibit 9b
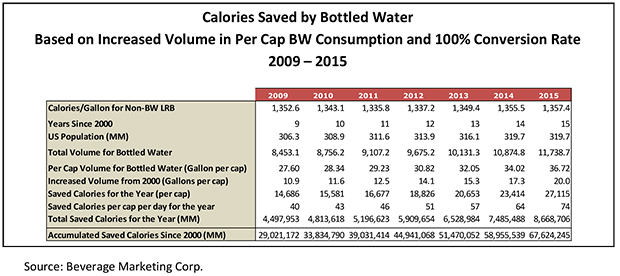
Exhibit 10 summarizes the calorie savings for each conversion rate for the 2000 to 2015 period.
Exhibit 10
Over the 15 year 2000 to 2015 period, the calories saved by consumers switching their beverage consumption from sweetened LRBs to bottled water has been enormous. The growth of bottled water has been the most significant beverage volumetric phenomena of the past 25 years. Bottled water's success has been driven in part by America's move to healthier beverage choices, which has resulted in calorie savings for all Americans. As consumers continue to drink more bottled water, these savings will become even greater in the years ahead. Caloric savings of this size and magnitude by any food or beverage category are rare.
Appendix
Appendix A1
Appendix A2
Appendix B1
Appendix B2
Appendix C1
Appendix C2